这里只是使用stalker 定位检测代码的演示,并无详细分析检测内容。
案例来源:最新版某banban加固分析,frida检测点定位,dump so,so修复,frida stalker使用_哔哩哔哩_bilibili
为什么厂商会检测pthread_create函数是否被hook?
一般创建检测线程会用这个函数,如果这个函数被hook了,就可以直接杀死检测线程了。厂商不单只会检测这个函数,有时也会对libc整体进行检测。libc 是 Android/Linux 系统的核心动态库,包含大量基础函数(如内存管理、文件操作、字符串处理等)。
定位检测代码的一般思路:
hook pthread_create:观察哪个线程启动后,frida就退出了。那个就是检测线程,之后再根据地址确认所在模块。
hook android_dlopen_ext:一般检测代码都会放到so中,所以需要确定是哪个so
hook JNI_OnLoad:
使用System.loadLibrary加载的so,会先执行init、init_array中代码,之后再执行JNI_OnLoad。
如果 检测代码是在 init、init_array中,那么hook JNI_OnLoad onEnter中代码不会被执行
如果 检测代码是在 JNI_OnLoad中,那么 hook JNI_OnLoad onLeave中代码不会被执行
1. 关键SO定位与脱壳
目标软件使用梆梆加固,有Frida检测。
// 进入手机,启动frida server,修改端口号
// adb shell
// cd /data/local/tmp
// su
// /data/local/tmp/fridaserver -l 0.0.0.0:1134
// adb 端口转发
// adb forward tcp:1134 tcp:1134
// 执行命令
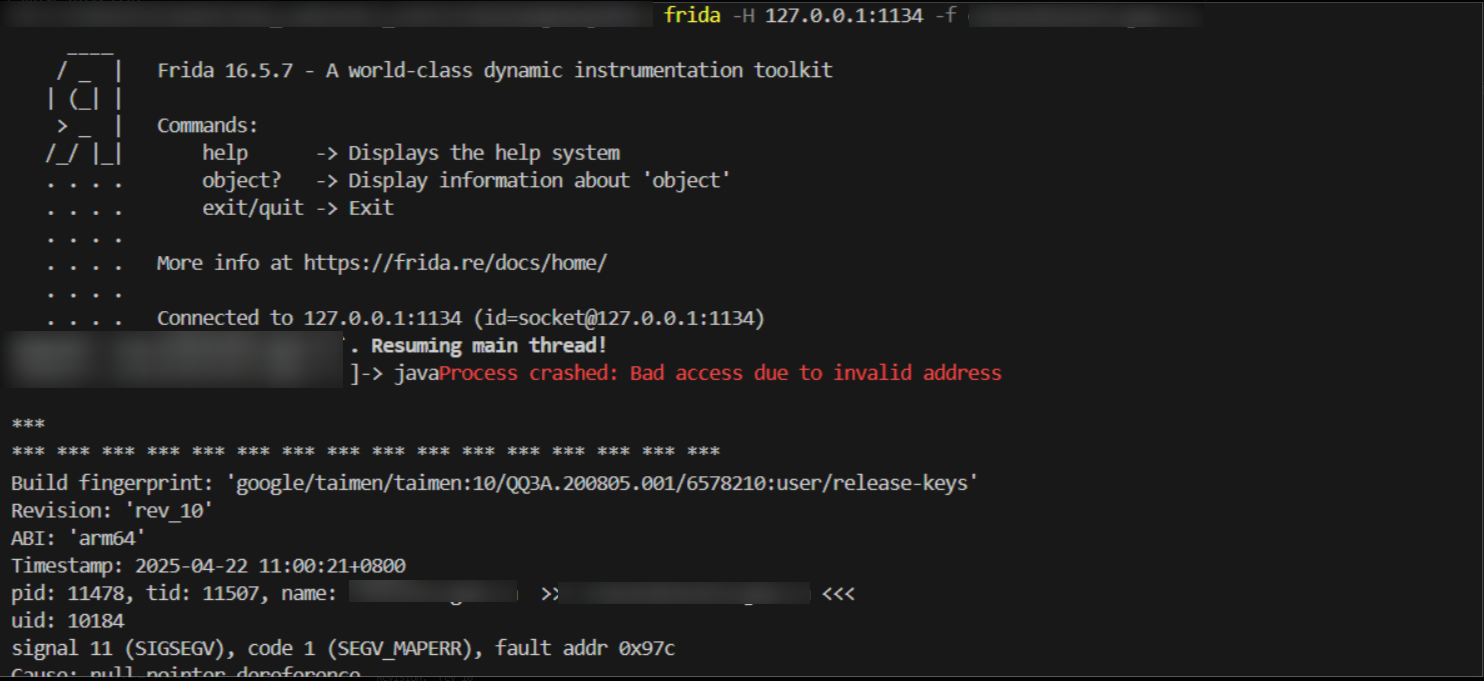
// frida -H 127.0.0.1:1134 -f com.xxx.xxx -l .\Anti_AntiFrida.js使用 frida -H 127.0.0.1:1134 -f com.xxx.xxx.cn注入app 会,frida 进程会崩溃。一般都会检测默认端口,所以这里修改一下端口号。
1. SO 定位
常检测会通过创建线程,定时检测。所以我们需要hook pthread_create,看它创建了哪些线程,这里通过replace 替换函数的方式去打印信息。
function create_pthread_create(tragetSo) {
    const pthread_create_addr = Module.findExportByName(null, "pthread_create")
    const pthread_create = new NativeFunction(pthread_create_addr, "int", ["pointer", "pointer", "pointer", "pointer"]);
    return new NativeCallback((parg0, parg1, parg2, parg3) => {
        const module = Process.findModuleByAddress(parg2);
        const so_name = module.name;
        const baseAddr = module.base;
        if (so_name.indexOf(tragetSo) !== -1) {
            console.log("pthread_create", so_name, "0x" + parg2.sub(baseAddr).toString(16), "0x", parg3.toString(16))
            return 0;
        }
        return pthread_create(parg0, parg1, parg2, parg3)
    }, "int", ["pointer", "pointer", "pointer", "pointer"])
}

// 或者
function replace_thread(tragetSo) {
    var new_pthread_create = create_pthread_create(tragetSo)
    var pthread_create_addr = Module.findExportByName(null, "pthread_create")
    console.log("pthread_create",pthread_create_addr);
    // 函数替换
    Interceptor.replace(pthread_create_addr, new_pthread_create);
}
之后再hook dlopen与JNI_OnLoad。因为,so加载之后,会先执行init、init_array中函数,之后再执行JNI_OnLoad,。而如果检测代码是在init、init_array中,那么JNI_OnLoad onEnter 就不会输出;而如果检测代码是在JNI_OnLoad中调用的,那么 onEnter 会输出,而onLeave不会。
function hook_dlopen(so_name, trace){
Interceptor.attach(Module.findExportByName(null, "android_dlopen_ext"), {
onEnter:function(args){
var pathptr = args[0];
if (pathptr !== undefined && pathptr != null) {
var path = ptr(pathptr).readCString();
console.log(path);
var libname = path.split("/")
this.libname = libname[libname.length-1];
if (path.indexOf(so_name) !== -1) {
this.match = true
}
}
},
onLeave:function(retval){
const module = Process.findModuleByName(this.libname);
hook_JNI_OnLoad(module);
// hook_JNI_OnLoad(module);
if (this.match) {
console.log(so_name, "加载成功")
if(trace){
}
}
}
})
}
function hook_JNI_OnLoad(module){
const JNI_OnLoad_Addr = module.findExportByName("JNI_OnLoad");
if(JNI_OnLoad_Addr ){
console.log(module.name, "addr: ", module.base, "JNI_OnLoad addr", JNI_OnLoad_Addr)
Interceptor.attach(JNI_OnLoad_Addr, {
onEnter:function(args){
console.log(module.name, "JNI_OnLoad onEnter")
},
onLeave:function(retval){
console.log(module.name, "JNI_OnLoad onLeave")
}
})
}
}
function main(){
const tragetSo = ""
replace_thread(tragetSo)
const trace = false;
hook_dlopen(tragetSo, false);
}
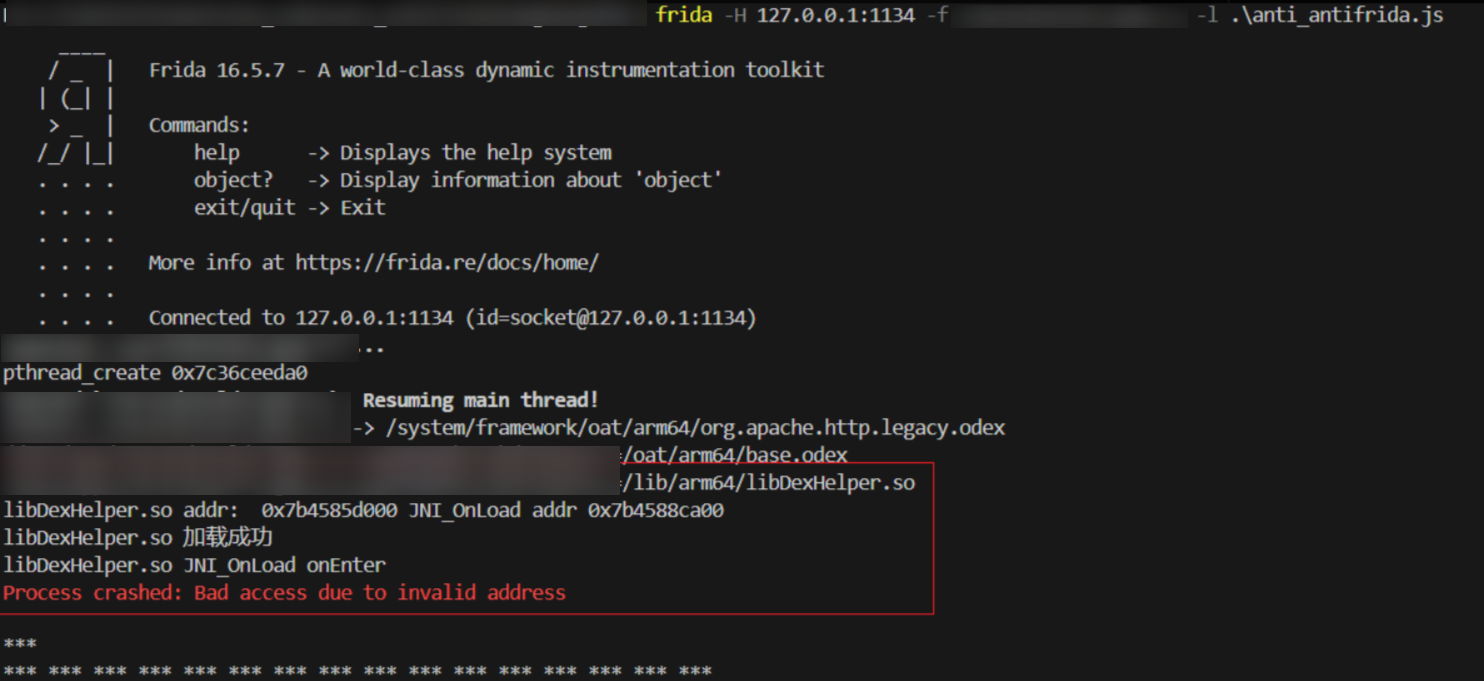
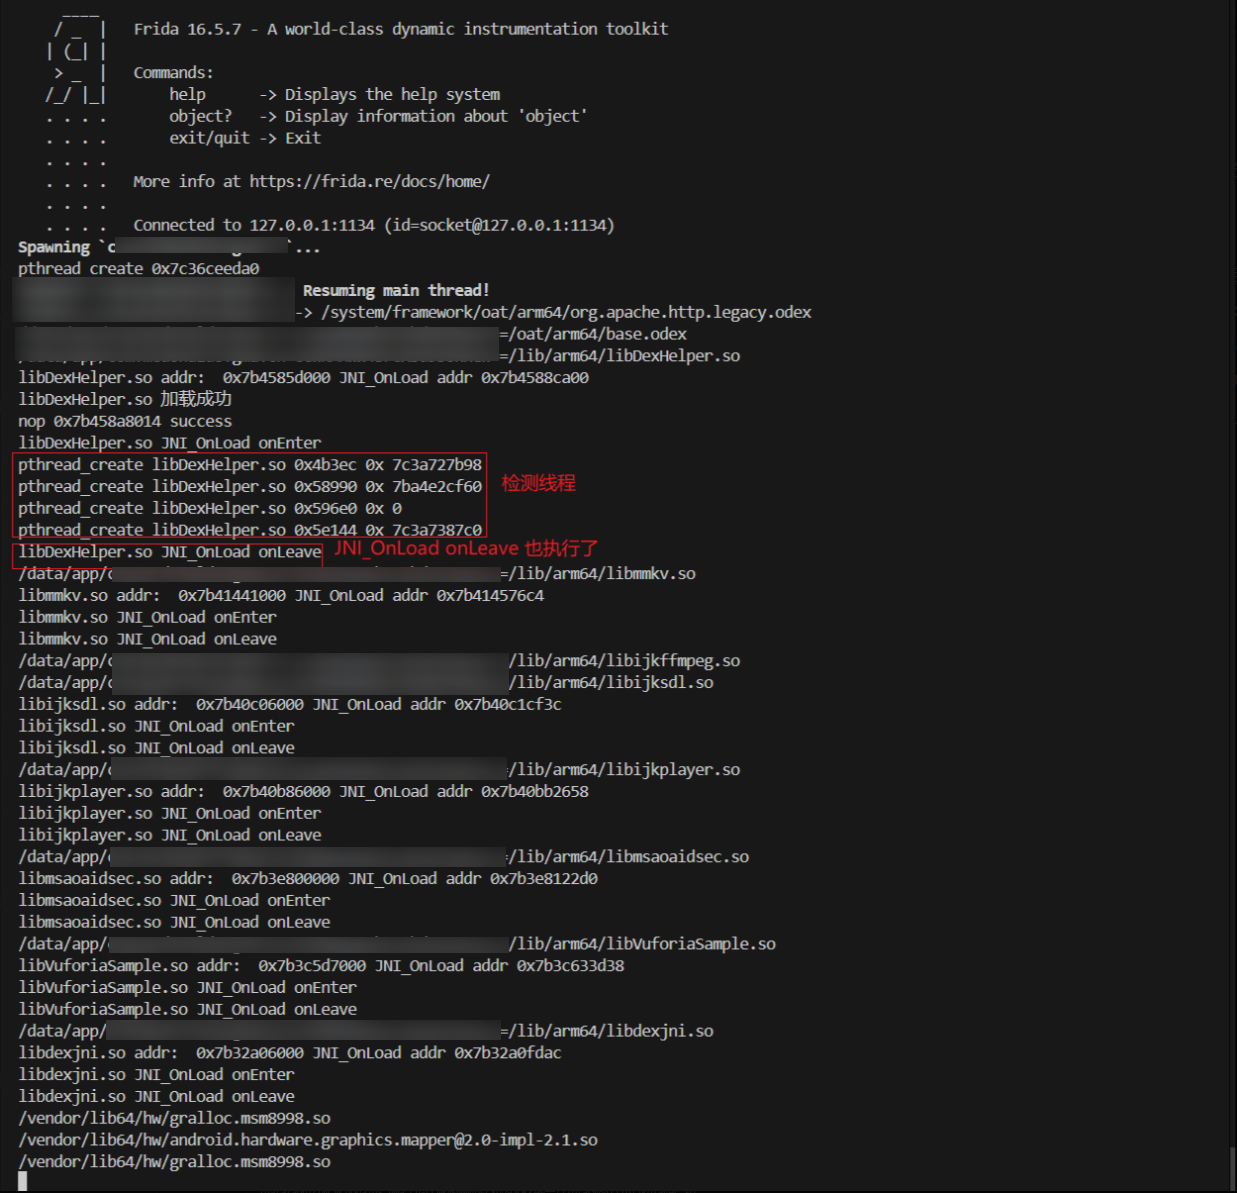
main();使用frida -H 127.0.0.1:1134 -f com.xxx.xxx.cn -l .\anti_antifrida.js 启动软件,根据输出可以看到如下模块被加载,包含梆梆加固的so模块:
2. 脱壳
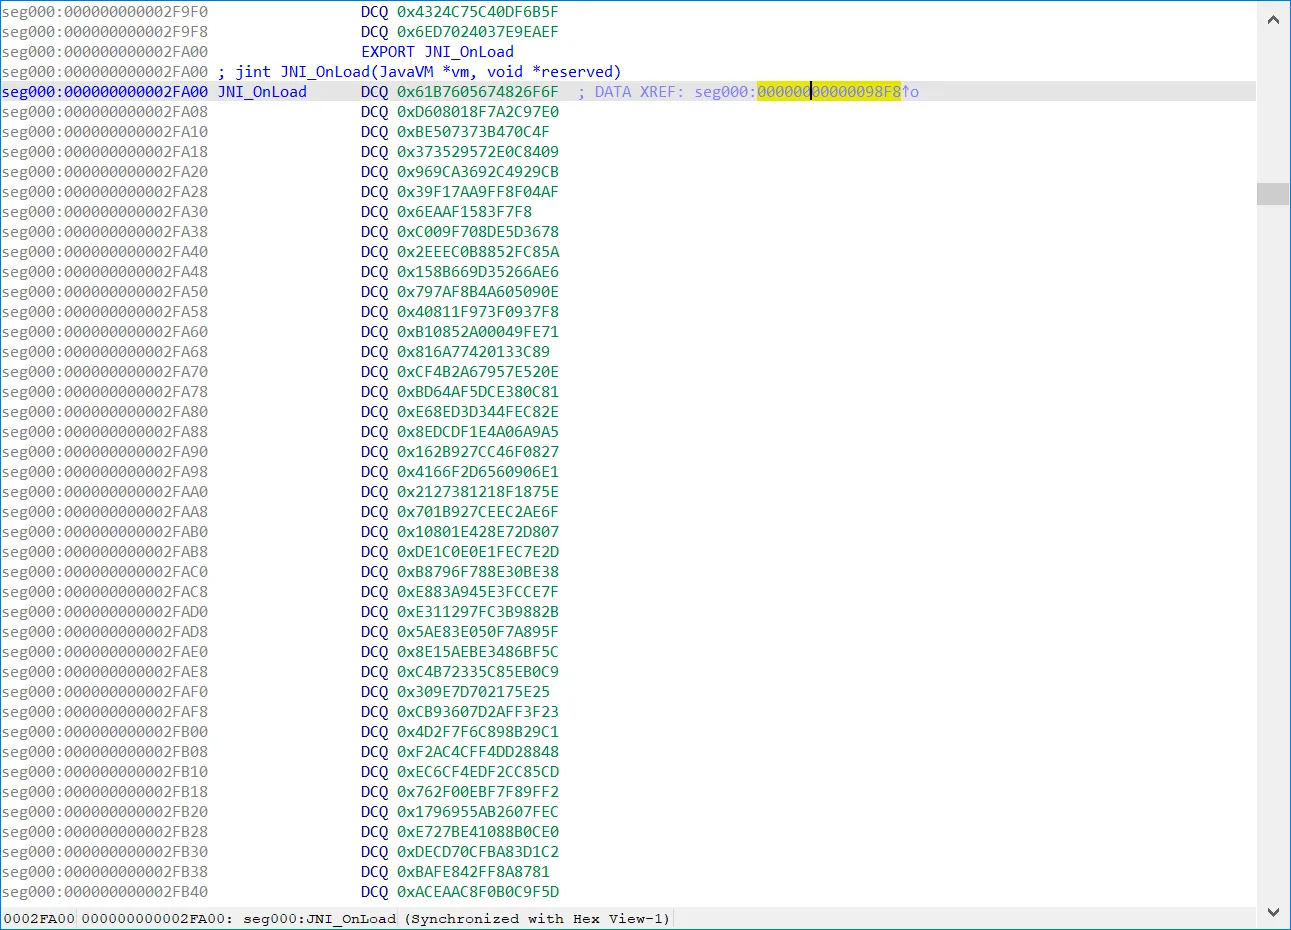
用IDA 打开 libDexHelper.so, 跳转到JNI_OnLoad处进行分析。看起来不是有效代码,接下来要对它进行脱壳。
 hook dlopen,在 libDexHelper.so 被加载后(onLeave)中dump。记得给软件文件权限!!!。
function dumpTargetSo(soNameKeyword) {
    Interceptor.attach(Module.findExportByName(null, "android_dlopen_ext"), {
        onEnter: function(args) {
            const pathPtr = args[0];
            if (pathPtr && !this.handled) {
                const path = pathPtr.readCString();
                if (path && path.includes(soNameKeyword)) {
                    this.target = true;
                    this.soPath = path;
                }
            }
        },
        onLeave: function(retval) {
            if (this.target) {
                const module = Process.getModuleByName(this.soPath.split("/").pop());
                if (module) {
                    console.log("start dump:", soNameKeyword,",base:", module.base,"size:", module.size, "to " );
                    const dumpPath = `/sdcard/Android/data/dump_${module.name}`;
                    Memory.protect(ptr(module.base), module.size, "rwx");
                    const data = Memory.readByteArray(module.base, module.size);
                    const file = new File(dumpPath, "wb");
                    file.write(data);
                    file.close();

                    console.log(`Dump完成: ${dumpPath}`);
                }
                this.target = false;
            }
        }
    });
}使用adb pull将对应文件pull到PC上,然后使用soFixer(GitHub - Chenyangming9/SoFixer)将其修复。之后再次使用IDA打开,查看JNI_OnLoad流程图,如果要从上到下分析,要花费很长时间,因此我们要借助Stalker trace,定位最后执行的位置,在那里开始分析。
2. Stalker 辅助定位检测位置
2.1 Stalker trace代码编写
依靠 stalker block trace 可以快速定位到检测代码块位置,接下来基于Stalker 编写 block trace 代码。
块起始判断:
通过
iterator.next()获取当前块的第一条指令地址 baseFirstAddress。检查该地址是否在 startBase ~ startBase+size 区间内,确定是否需要记录。
块信息记录:
若在目标区间内,记录模块名、块起始地址、相对于模块基址的偏移量等信息到
logBuffer。
指令级遍历:
使用 do-while 循环遍历块内所有指令。
对每条指令记录其 绝对地址、块内偏移 和 反汇编内容。
iterator.keep()保留原始指令,确保程序逻辑不受影响。
// stalker block trace 打印trace 出来的块,一般在函数的onEnter中执行
// curTid:目标线程 ID,可通过 Process.getCurrentThreadId() 获取。
// module:目标模块对象(如 Module.findBaseAddress('libtarget.so'))。
// startBase:追踪的起始地址(需为 绝对地址,如 module.base + 0x1234)。
// size:追踪范围大小,限定地址区间为 [startBase, startBase + size]。
function stalker_blockTrace(curTid, module ,startBase, size){
Stalker.follow(curTid, {
transform: function (iterator) {
let instruction = iterator.next();
// 当前块的起始地址
const baseFirstAddress = instruction.address;
// 判断是否在startBase ~ startBase+size 区间内
const isModuleCode = baseFirstAddress.compare(startBase) >= 0 &&
baseFirstAddress.compare(startBase.add(size)) <= 0;
// 根据当前块的地址,获取属于哪个模块
// const module = Process.findModuleByAddress(baseFirstAddress);
if (isModuleCode) {
// 确认属于要trace的区间内, 获取块起始地址、偏移、模块名称、基址等信息
const name = module.name;
const offset = baseFirstAddress.sub(module.base);
const base = module.base;
logBuffer.push(`[transform] start: ${baseFirstAddress} name:${name} offset: ${offset} base: ${base}`);
}
do {
if (isModuleCode){
// 循环打印每条指令相关信息
const curRealAddr = instruction.address;
const curOffset = curRealAddr.sub(baseFirstAddress);
const curOffsetInt = curOffset.toInt32()
const instructionStr = instruction.toString()
logBuffer.push("\t" + curRealAddr + " <+" + curOffsetInt + ">: " + instructionStr);
}
iterator.keep();
} while ((instruction = iterator.next()) !== null);
if (isModuleCode){
logBuffer.push("\n")
}
}
});
}
Trace大量指令,使用频繁使用 console.log 进行 输出,可能会导致阻塞卡死,因此自定义一个logBuffer来处理日志,通过缓冲批处理,减少I/O次数,降低系统开销。
LogBuffer类:queue: 存储待输出日志的数组,避免直接写入控制台造成的性能瓶颈。lock(未启用): 预留的并发控制标识,当前代码未实际使用,需扩展以实现线程安全。方法:
push(message): 将日志加入队列,时间复杂度 O(1)。flush(): 复制并清空队列,返回所有累积日志,确保操作原子性(需加锁扩展)。hasLogs(): 检查队列非空,用于触发输出条件。
日志消费者(logConsumer)
定时轮询: 每 30ms 检查一次缓冲区,若有日志则批量输出。
性能权衡: 短间隔(30ms)保证日志及时性,但可能增加CPU负载;可根据场景调整间隔。
class LogBuffer {
    constructor() {
        this.queue = [];
        this.lock = false;
    }

    // 添加日志信息
    push(message) {
        this.queue.push(message);
    }

    // 获取并清空日志信息
    flush() {
        const messages = this.queue.slice();
        this.queue = [];
        return messages;
    }

    // 检查队列是否有内容
    hasLogs() {
        return this.queue.length > 0;
    }
}

//线程安全,缓冲区校验
class SafeLogBuffer {
    constructor(maxSize = 1000) {
      this.queue = [];
      this.lock = false;
      this.maxSize = maxSize; // 防内存溢出
    }

    push(message) {
      if (this.queue.length >= this.maxSize) {
        this.queue.shift(); // 丢弃旧日志
      }
      // 伪代码: 实际需用Atomics或Mutex实现锁
      while (this.lock) { /* 等待 */ }
      this.lock = true;
      this.queue.push(`${Date.now()}: ${message}`);
      this.lock = false;
    }

    flush() {
      while (this.lock) { /* 等待 */ }
      this.lock = true;
      const logs = this.queue.slice();
      this.queue = [];
      this.lock = false;
      return logs;
    }
  }

// 创建一个日志缓冲区实例 按需使用
const logBuffer = new LogBuffer();
// const logBuffer = new SafeLogBuffer();

// 消费者函数:定期输出日志
function logConsumer() {
    setInterval(() => {
        if (logBuffer.hasLogs()) {
            const logs = logBuffer.flush(); // 获取所有日志
            console.log(logs.join('\n'));   // 输出日志
        }
    }, 30); // 每30ms钟输出一次
}

main(){
    // 启动消费者线程(定期打印日志)
    logConsumer();
  ...
}
在代码结束代码跟踪时回收内存,停止跟踪并清理残留数据,建议在 onLeave中调用。
// 确保 unfollow() 和 garbageCollect() 在 主线程 调用,避免多线程竞争导致崩溃。
// 资源释放函数
function stalker_traceEnd() {
try {
Stalker.flush(); // 确保日志写入完成
Stalker.unfollow();
} catch (e) {
console.log('Cleanup error:', e.message);
} finally {
Stalker.garbageCollect();
}
} 般使用trace 一个函数的指令,应该限制trace的指令范围在[ funcAddr, funcAddr + length ]。而且trace开始时机应该在onEnter,在onLeave中停止并清理资源。因此trace_sub_function 函数代码逻辑如下:
参数:
module:目标 .so 模块对象(如 libnative.so)。curTid:线程 ID,若为空则自动获取当前线程。funcOffset:目标函数在模块内的偏移地址length:跟踪的指令范围长度。
function trace_sub_function(module, curTid, funcOffset, length) {
  const sub_function = module.base.add(funcOffset); // 计算函数绝对地址
  Interceptor.attach(sub_function, { // 绑定函数入口/出口的钩子
    onEnter: function(args) {
      if (curTid === "") { // 动态获取线程ID
        curTid = Process.getCurrentThreadId();
      }
      stalker_blockTrace(curTid, module, sub_function, length); // 启动指令追踪
    },
    onLeave: function(retval) {
      stalker_traceEnd(); // 停止追踪并清理资源
    }
  });
}
2.2 Stalker 辅助定位检测位置
1. JNI_OnLoad
根据之前hook代码输出,确认需要trace的函数是libDexHelper.so的JNI_OnLoad。因为onEnter输出了,而onLeave没有,说明退出是在JNI_OnLoad执行中退出的。编写trace_JNI_OnLoad:
// ● module:目标 .so 模块对象(如 libnative.so)。
// ● curTid:线程 ID,若为空则自动获取当前线程。
// ● length:跟踪的指令范围长度。
function trace_JNI_OnLoad(module, curTid, length){
const JNI_OnLoad_Addr = module.findExportByName("JNI_OnLoad");
console.log(module.name, module.base, JNI_OnLoad_Addr);
trace_sub_function(module, curTid, JNI_OnLoad_Addr.sub(module.base), length);
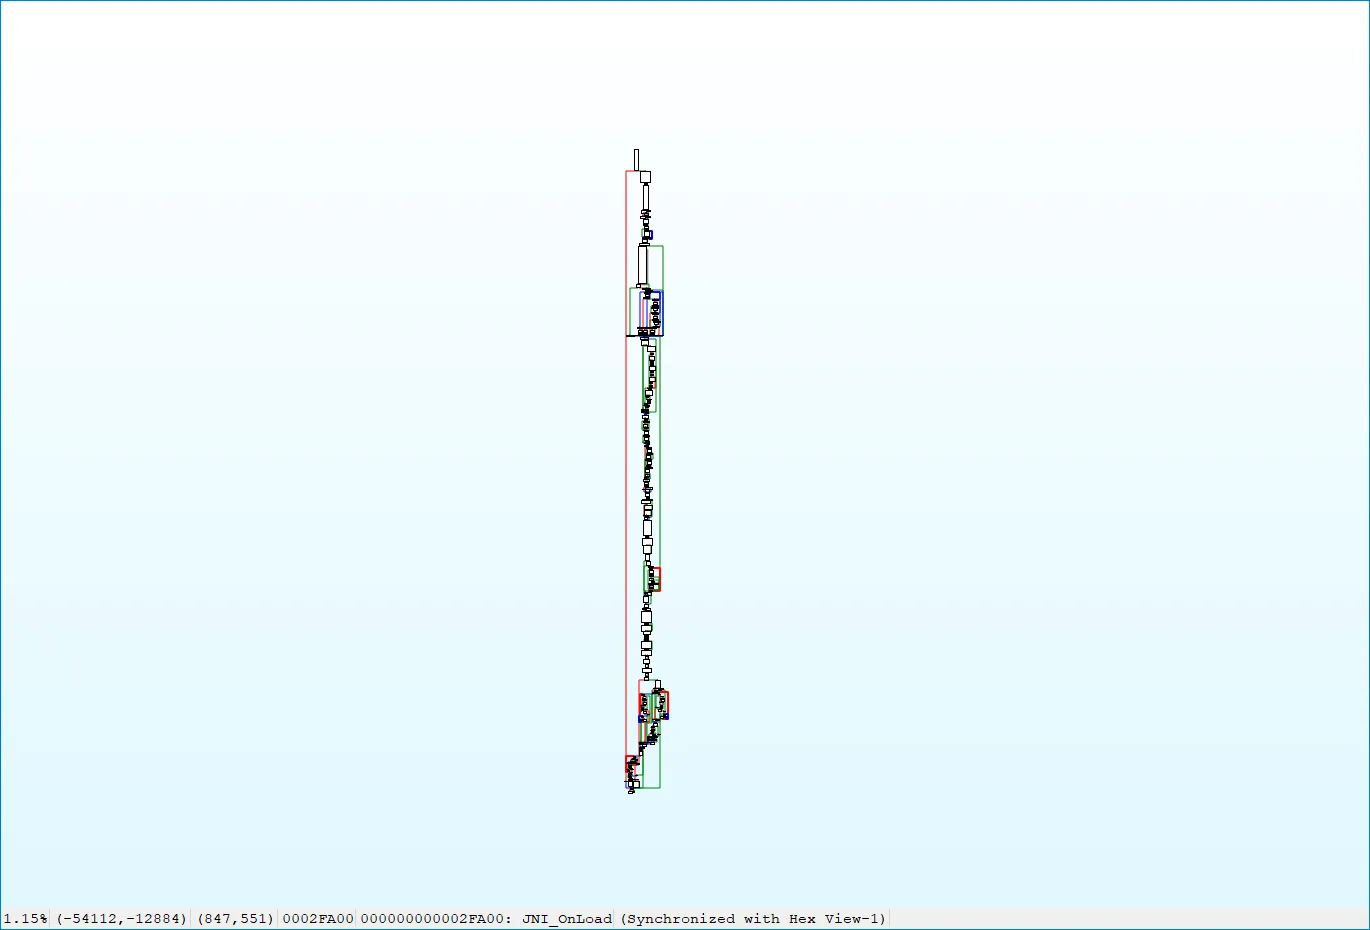
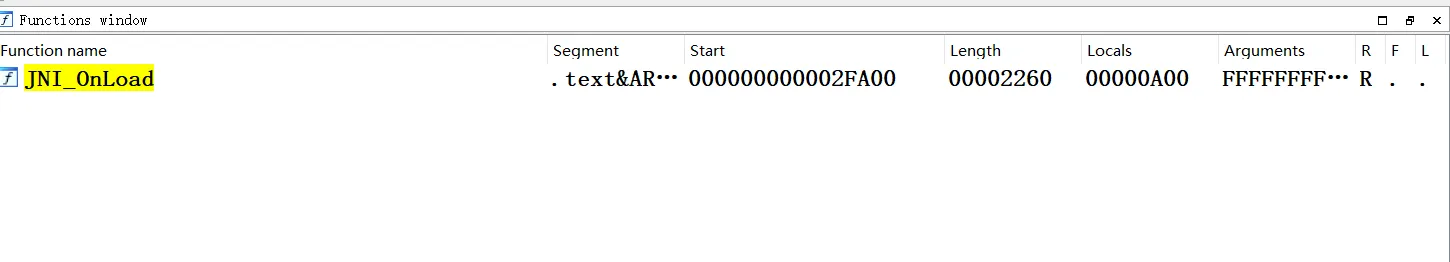
}通过IDA的function视图,获取JNI_OnLoad的length:
在hook_dlopen的onLeave中调用,使用命令frida -H 127.0.0.1:1134 -f com.xxx.xxx.cn -l .\anti_antifrida.js >> trace_JNI_OnLoad.log开始trace,并将trace的输出写入文件。
...
onLeave:function(retval){
// const module = Process.findModuleByName(this.libname);
// hook_JNI_OnLoad(module);
if (this.match) {
console.log(so_name, "加载成功");
const module = Process.findModuleByName(this.libname);
// 获取当前线程的id
const curTid = Process.getCurrentThreadId();
// hook_JNI_OnLoad(module);
if(trace){
// 测试stalker 是否可用
// stalker_baseTest(curTid);
// console.log("测试没崩溃");
// trace JNI_OnLoad
trace_JNI_OnLoad(module, curTid, 0x2260);
}
}
}
...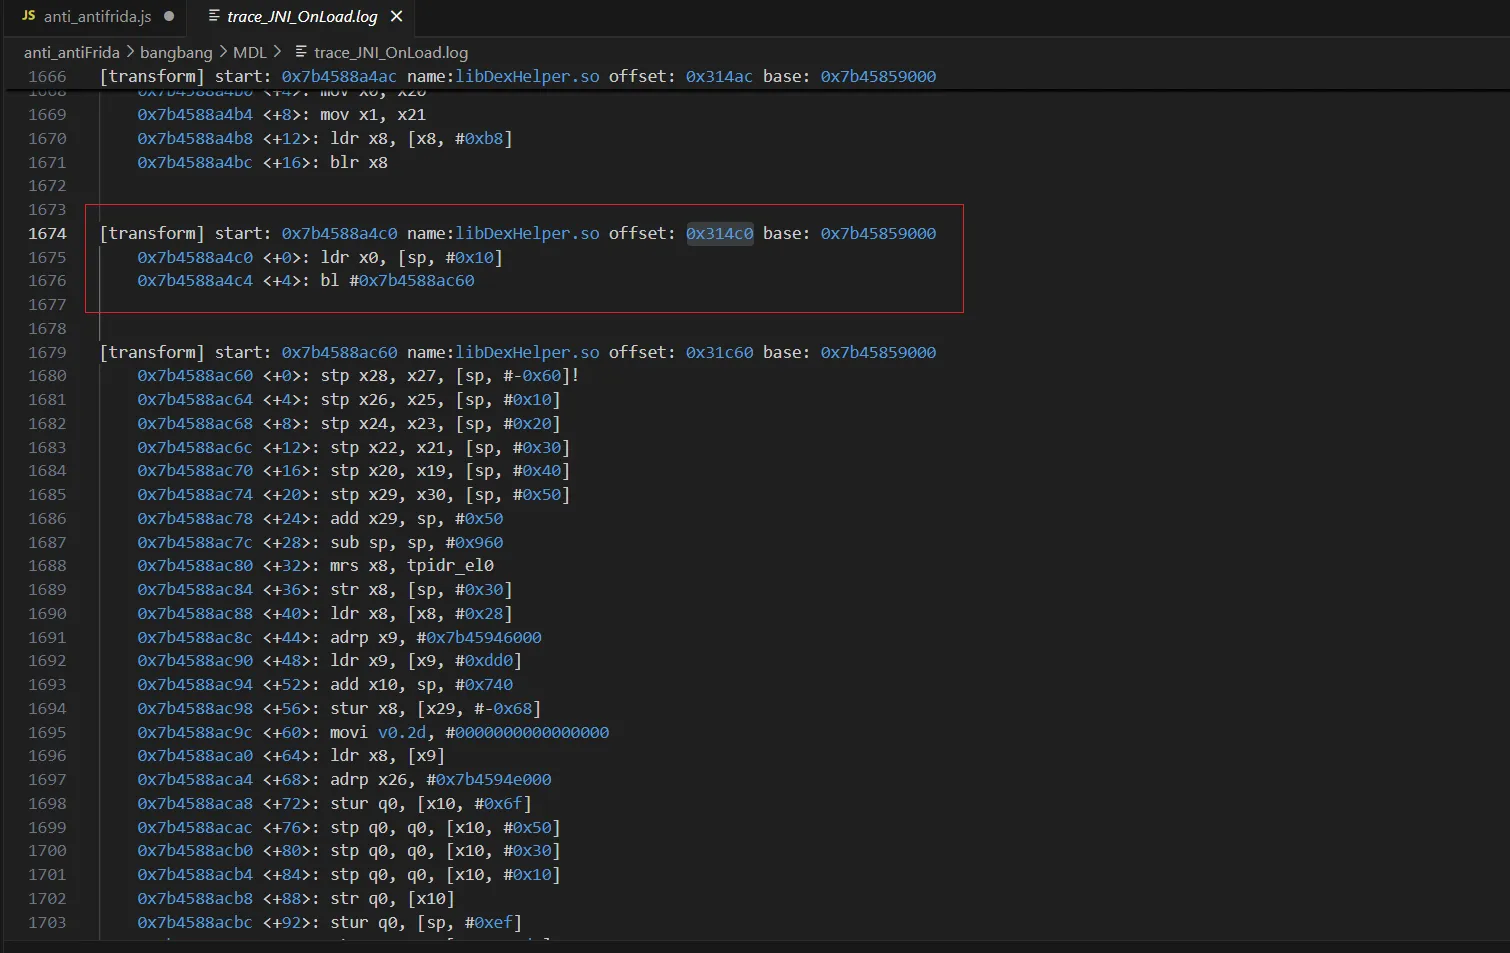 查看trace_JNI_OnLoad.log 输出,根据最后一块的偏移,在IDA中跳转到对应位置
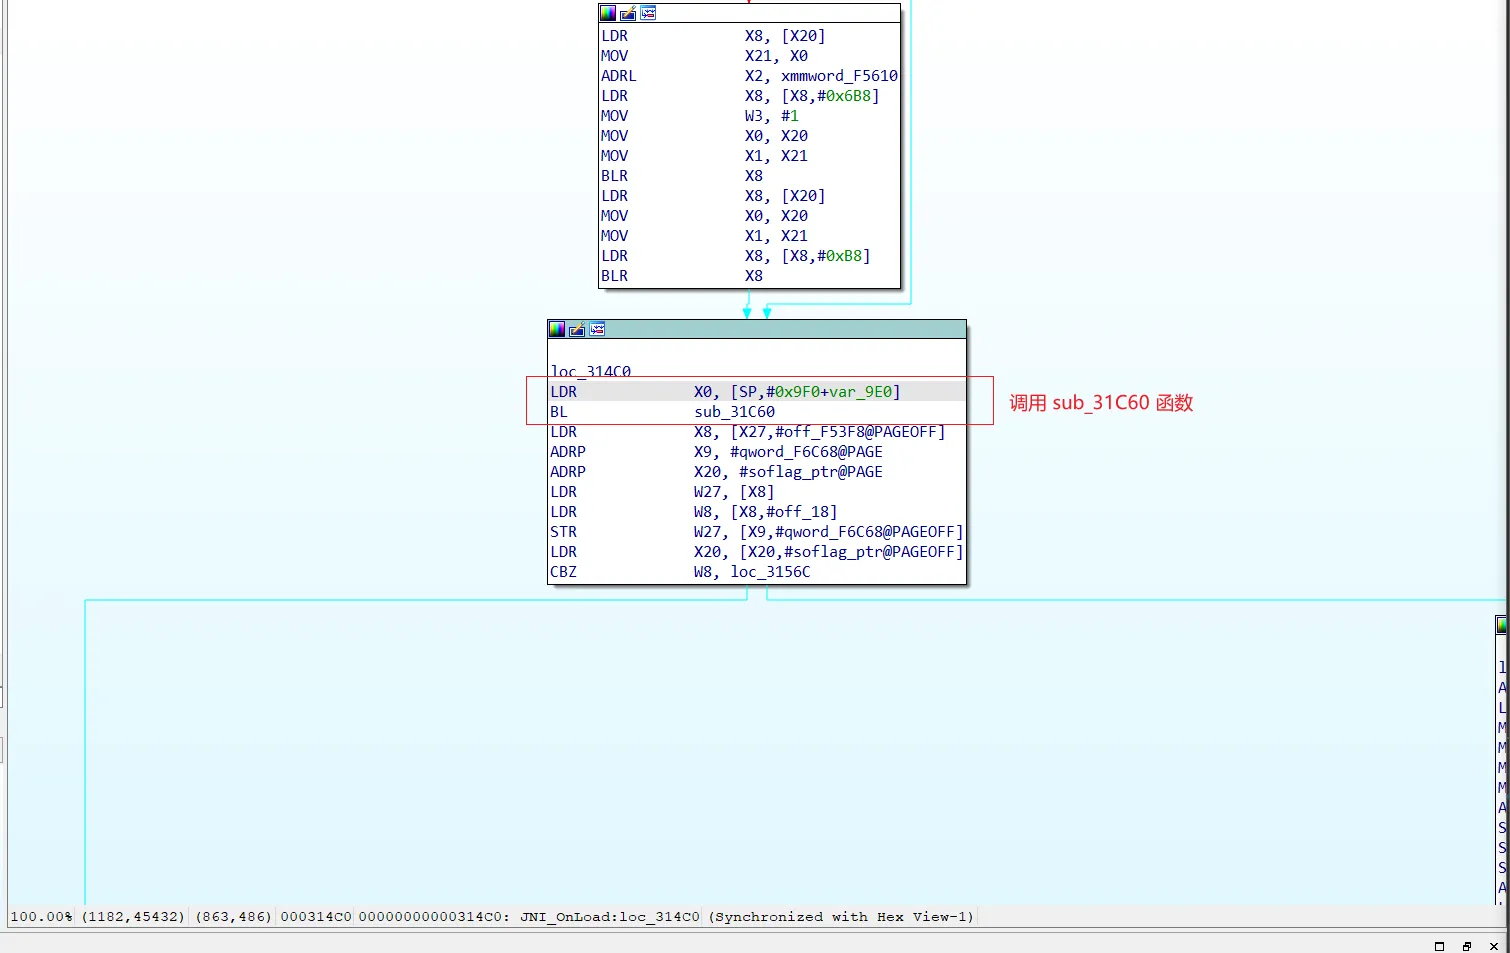
0x31c60,发现是一个函数,不在JNI_OnLoad函数中。那就查看倒数第二块0x314c0,IDA 跳转到对应位置,发现正是在 bl sub_31c60之后,frida 就终止了。
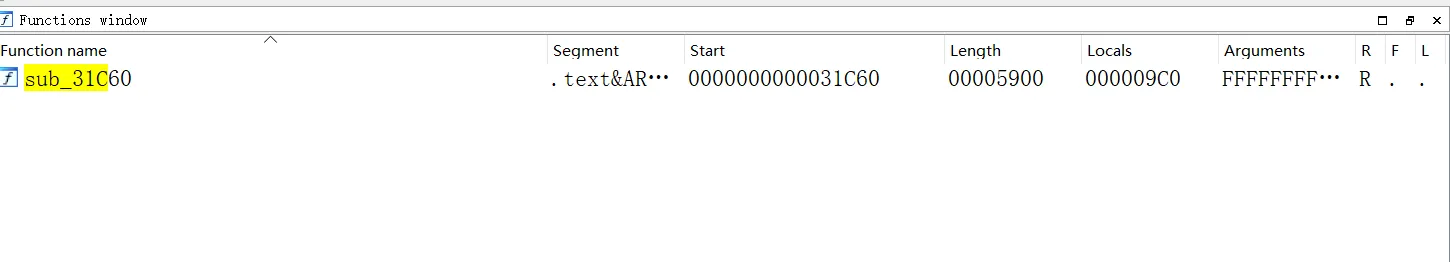
2. sub_31C60
对函数sub_31c60进行trace,命令frida -H 127.0.0.1:1134 -f com.xxx.xxx.cn -l .\anti_antifrida.js >> trace_sub_31C60.log
...
// trace sub_31C60
trace_sub_function(module, curTid, 0x31C60, 0x5900)
...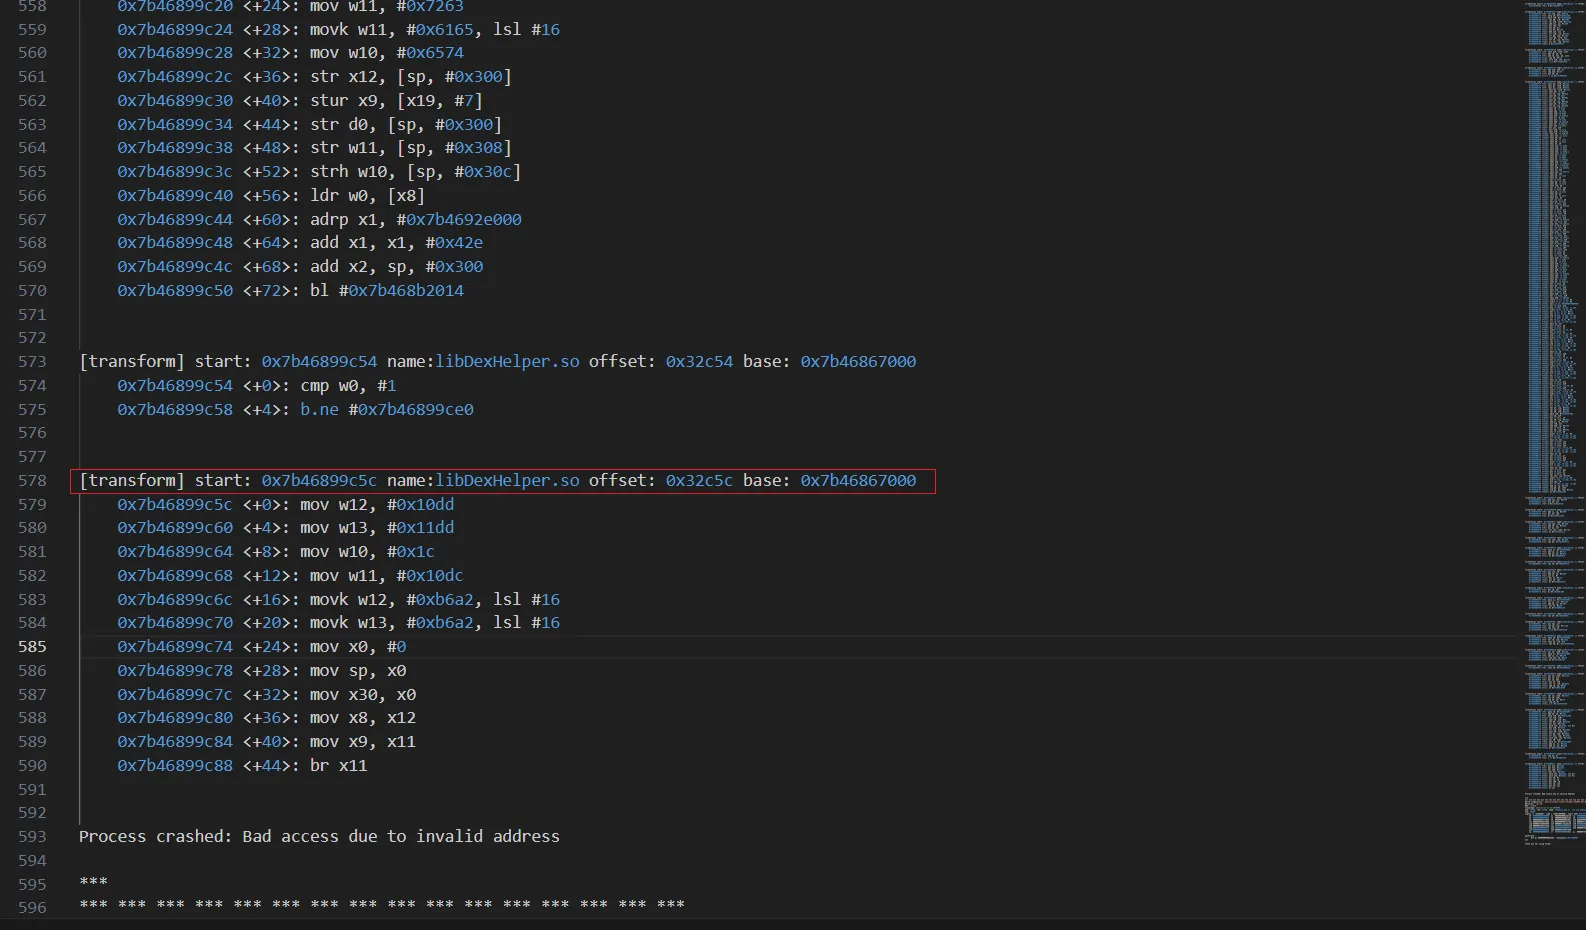
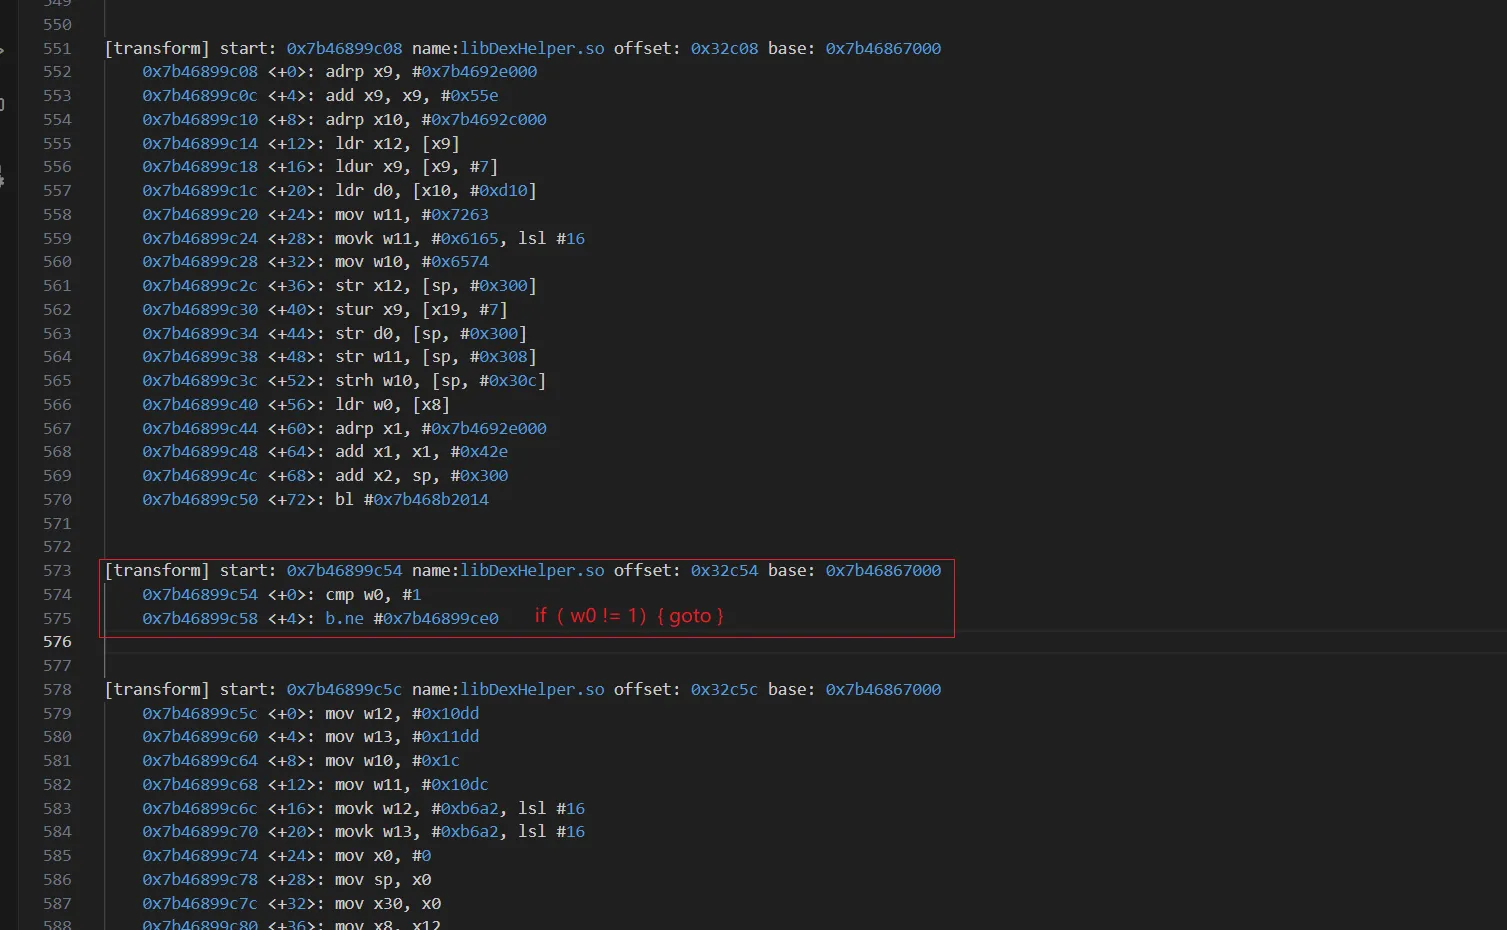
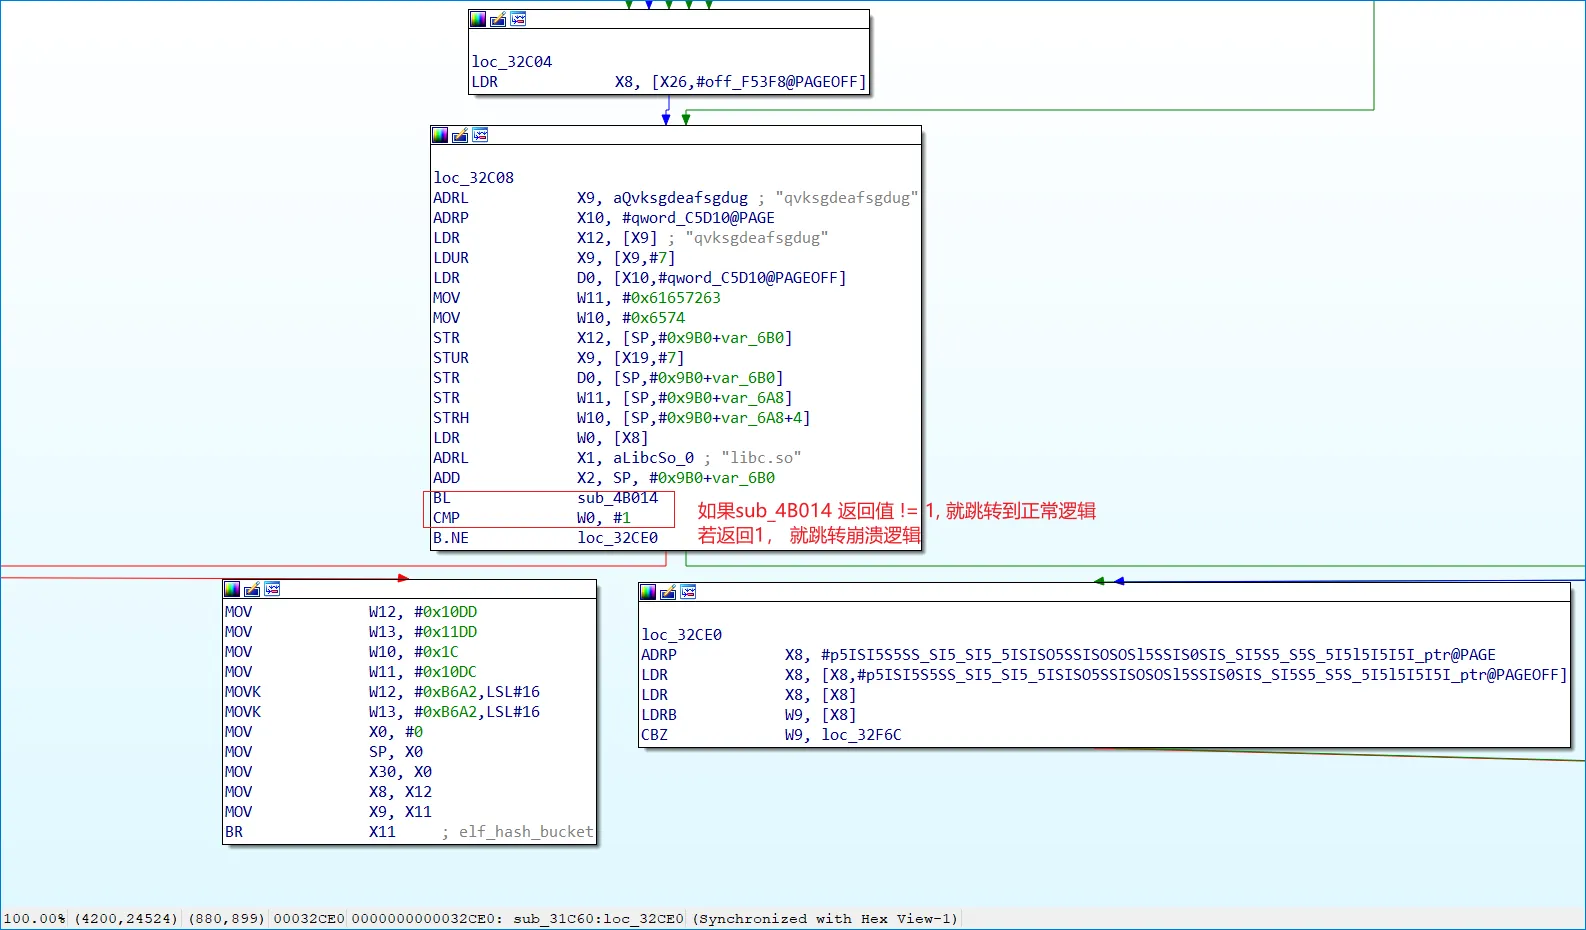
根据trace文件中地址,在IDA中跳转到对应位置0x32c5c:
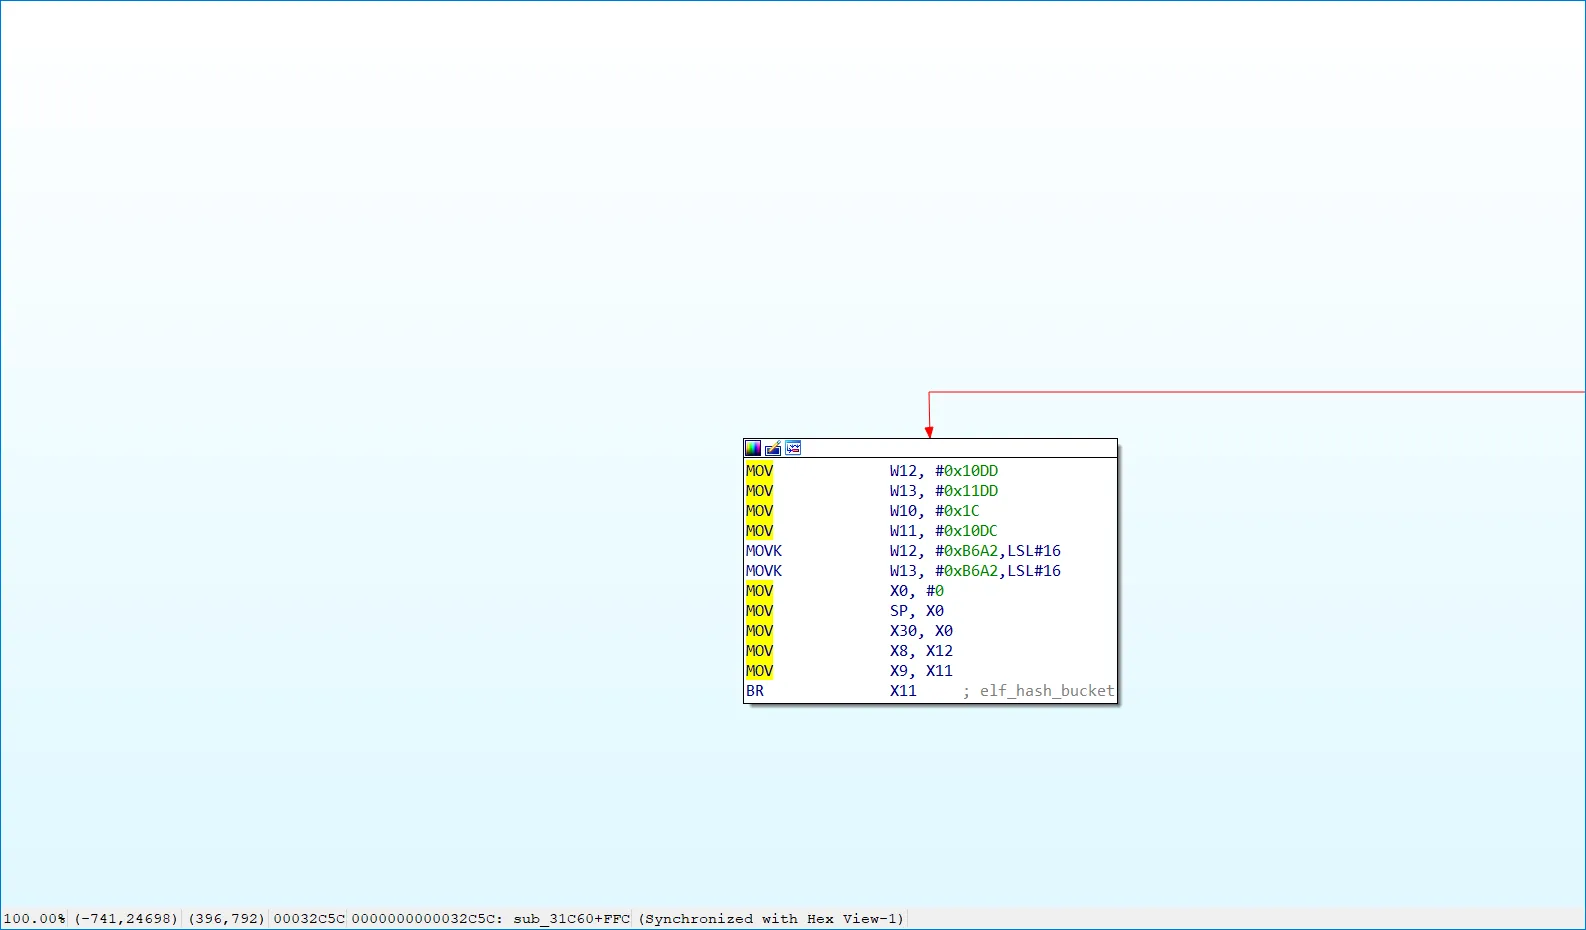
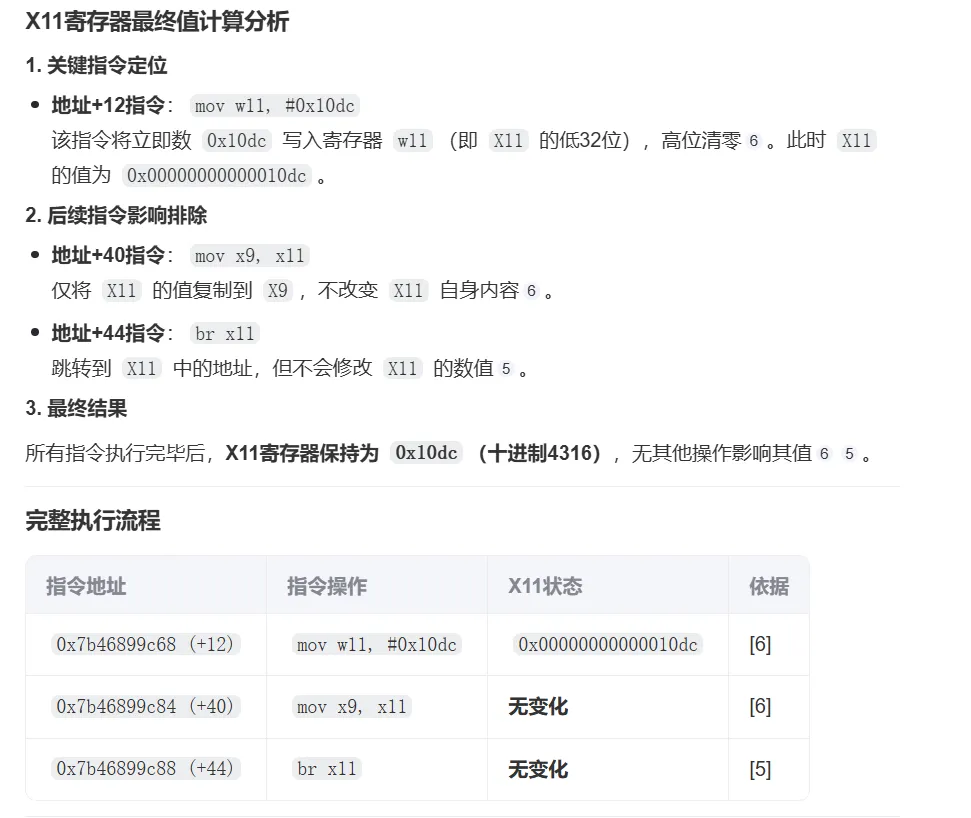
让AI帮忙计算算一下X11寄存器最终的值,最终x11的值是0x10dc :
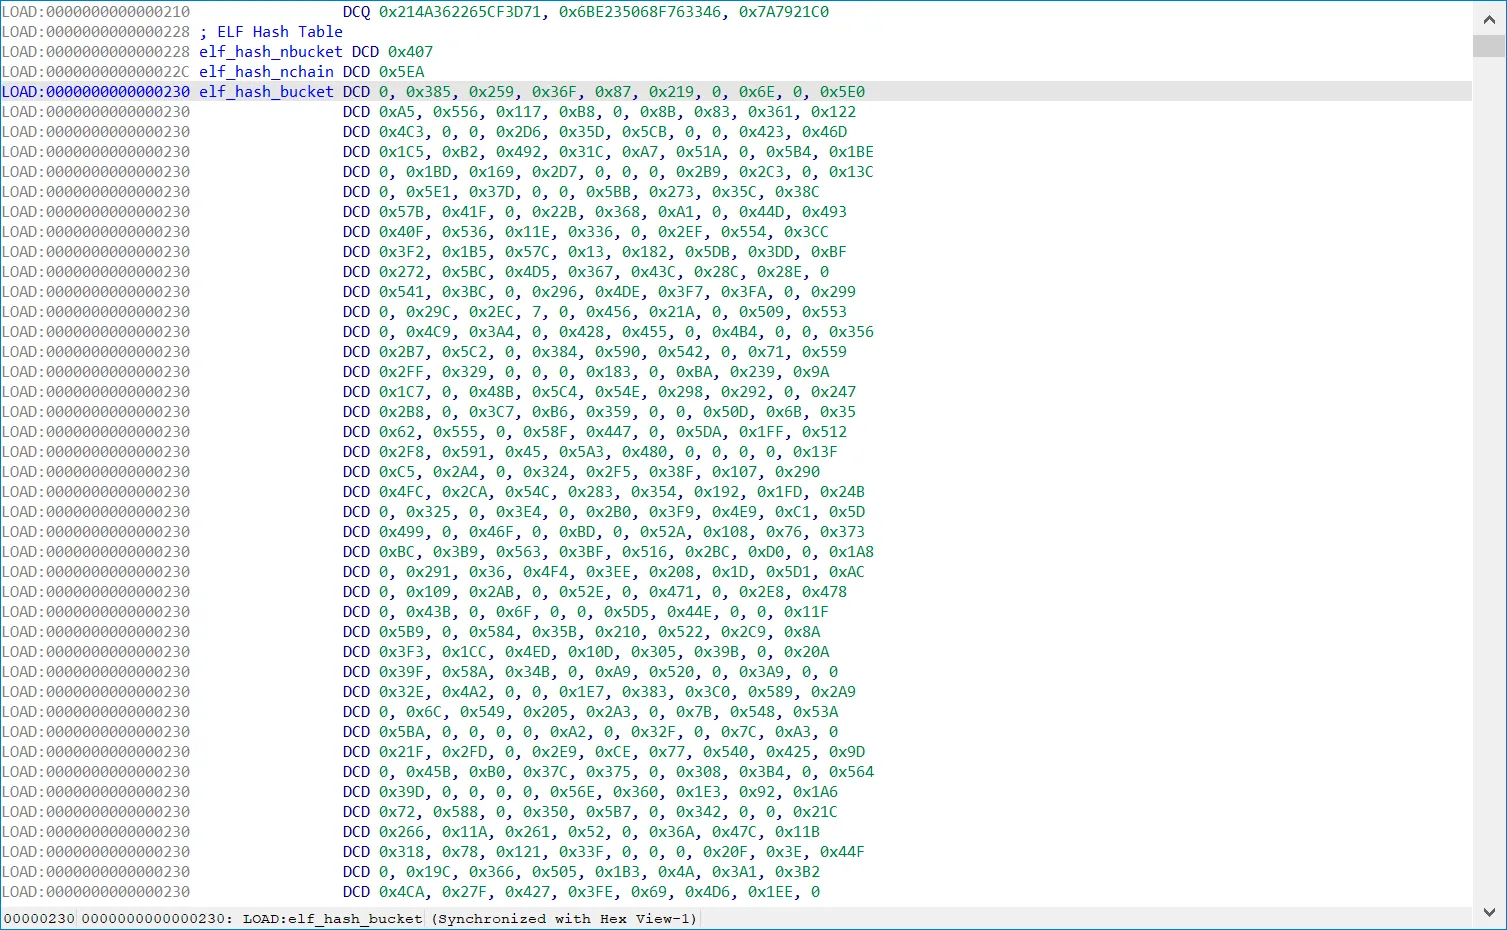
IDA跳转到0x10dc,是一个不可执行的区域,所以上面逻辑就是通过 br跳转到一个不可执行区域,引发程序崩溃,然后退出。
查看trace输出的倒数第二块内容,代码含义是:若 W0 ≠ 1,跳转到 0x7b46899ce0 执行(即引发崩溃)。
再继续向上看,w0来源于 bl #0x7b468b2014,即 某个函数调用后的返回值。
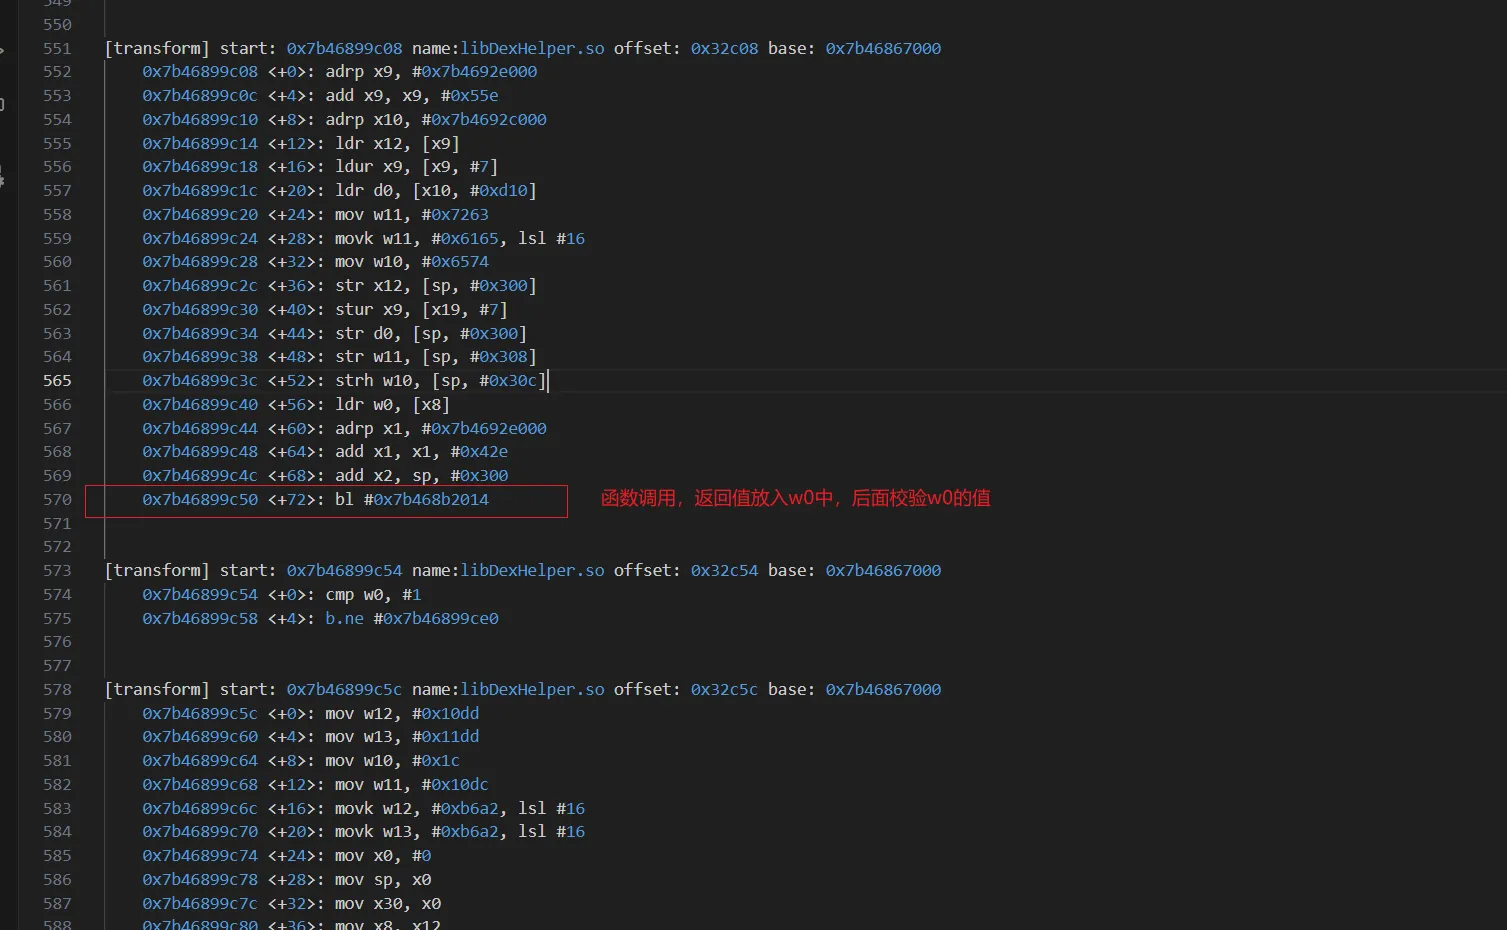
使用 IDA 跳转到对应位置,可以看到逻辑和上面分析的差不多,因此sub_4B014函数就是时机检测到了frida的函数。
3. 检测绕过
根据上面的分析,我们只需要将sub_4B014patch,让他返回0即可。
function patch_sub_function_return_0(module, funcOffset){
    Interceptor.attach(module.base.add(funcOffset),{
        onLeave: function (retval) {
            retval.replace(ptr(0));
        }
    });
}
在hook_dlopen的onLeav中执行
...
onLeave:function(retval){
            // const module = Process.findModuleByName(this.libname);
            // hook_JNI_OnLoad(module);
            if (this.match) {
                console.log(so_name, "加载成功");
                const module = Process.findModuleByName(this.libname);
                // 获取当前线程的id

                hook_JNI_OnLoad(module);

                if(trace){
                    const curTid = Process.getCurrentThreadId();
                    // 测试stalker 是否可用
                    // stalker_baseTest(curTid);
                    // console.log("测试没崩溃");

                    // trace JNI_OnLoad
                    // trace_JNI_OnLoad(module, curTid, 0x2260);

                    // trace sub_31C60
                    // trace_sub_function(module, curTid, 0x31C60, 0x5900)

                    patch_sub_function_return_0(module, 0x4B014);
                }
            }
        }
...
成功绕过libDexHelper.so的Frida检测。
4. 补充
当你使用Java.use 等Java API时,libmsaoaidsec.so会检测ART hook,在
create_pthread_create中添加nop libmsaoaidsec.so的线程代码就好了。libmsaoaidsec.so模块中的检测代码就不是在JNI_OnLoad中,而是在init、init_array,网上相关文章也多,之后有时间也补一个。
 if (so_name.indexOf("libmsaoaidsec.so") !== -1) {
            console.log("pthread_create", so_name, "0x" + parg2.sub(baseAddr).toString(16), "0x", parg3.toString(16))
            return 0;
 }